


Analysis
Index Study
Index study is performed to adjust the Base Cost of all types of buildings. Since county don’t adjust the Cost Manual every year, this study will be done periodically by taking the new constructions on the parcels which has sales and compare those sales value (i.e. Improvement value through sale) with Base Cost, to calculate an index which adjust the Base Cost, to all the buildings in the county. Typically, this study will be done in the base year (Starting year of the cycle). For mobile homes, state will separately send an Index directly, so county can apply that index on all parcels, which carrying mobile homes. Index study in the Capture will be triggered through the Sales Recording. When appraiser users doing sales recording, if there is a significant change between the appraised value and sales price for land only parcels, user can mark those parcels for index study. Capture has ability to track the parcels, when the user pick up the new improvement on the base year (through Permits, Field Visits, etc.) then those parcels will automatically move to the Index Study.
Workflow
User marked the parcel in sales recording for an Index Study.
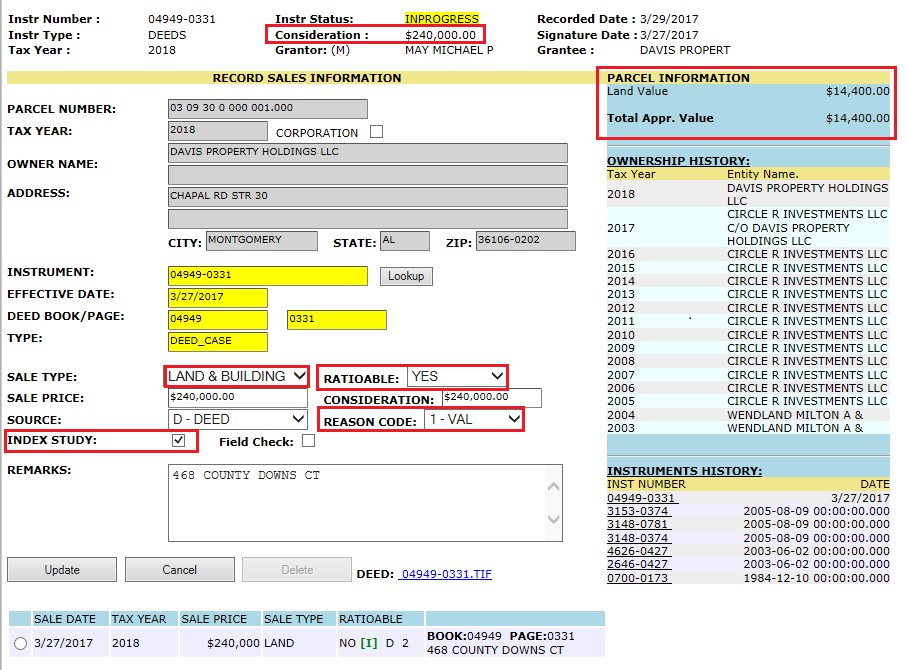
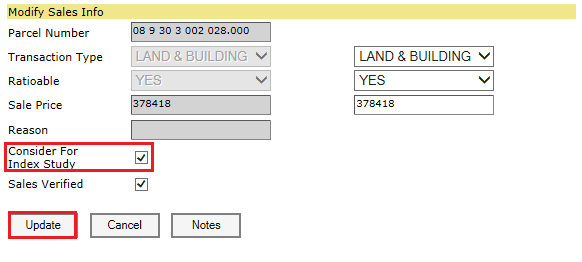
Also, user can remove or add the parcels for index study by clicking on sales price hyperlink and marking / deselecting the checkbox.
All Parcels marked for index study will be shown under Index study tab. Then, click on Index study hyperlink.
Navigation: Index study -> Index study.
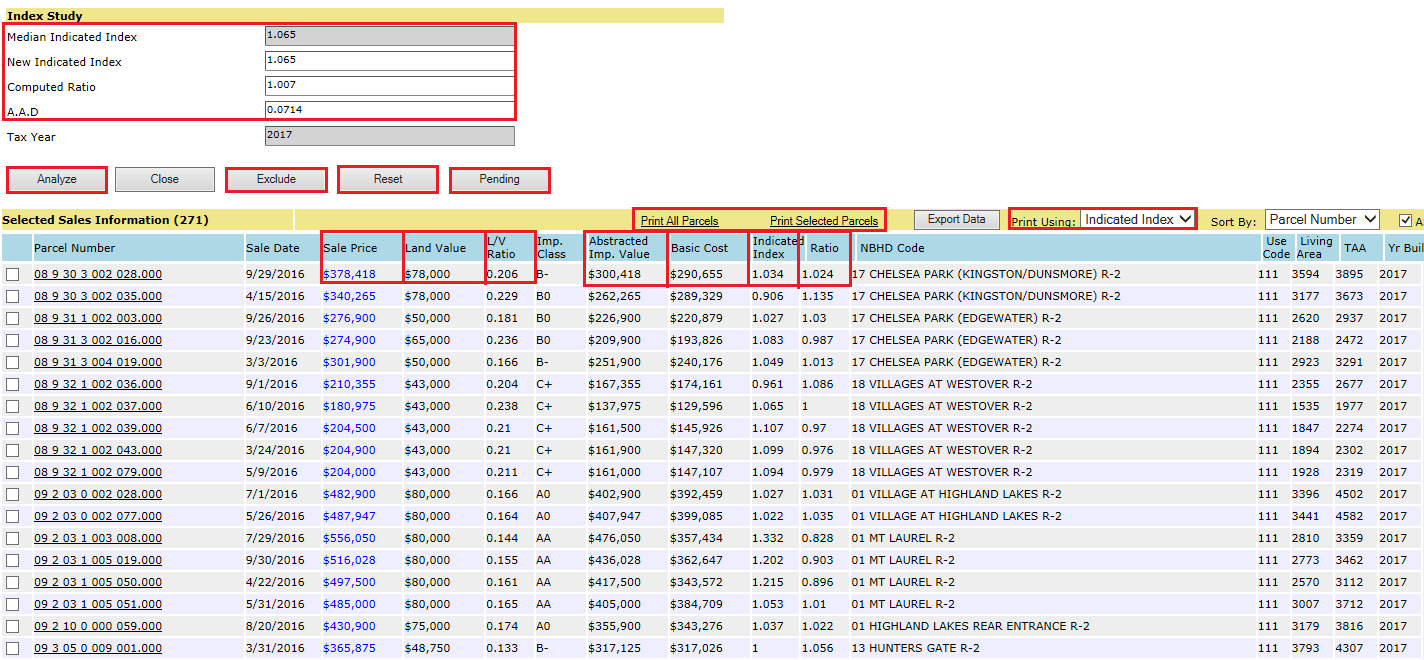
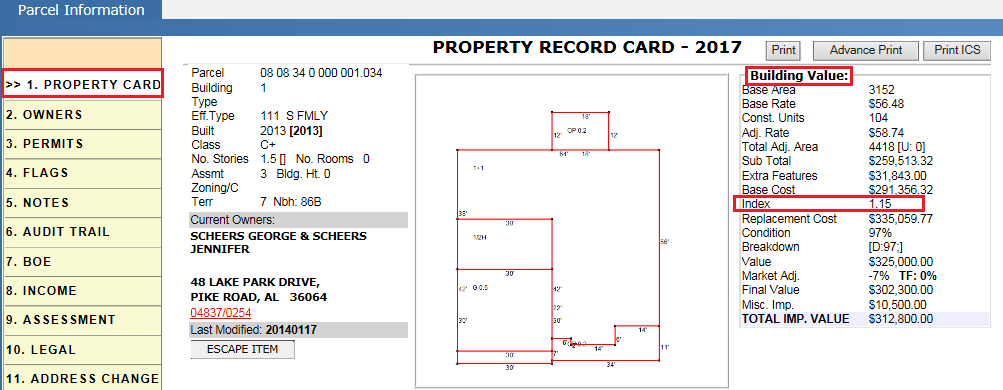
Sale Price: The consideration amount, which the property is sold for (Ex: $378,418).
Land Value: land value of the parcel (Ex: $78,000).
L/V Ratio: It gives the portion of land involved in the sales price (Ex: $78,000 / $378,418 = 0.206).
Abstracted Imp. Value: Subtract the land value from the sales price (Ex: $378,418 - $78,000 = $300,418).
Basic Cost: This is the value (i.e. Base Cost) taken from the parcel, which was calculated as per the cost approach (Ex: $290,655).
Indicated Index: It is the ratio of Abstracted Imp. Value to the Basic Cost (Ex: $378,418 / $290,655 = 1.034). This indicated index for the individual parcels shows whether the demand for that building gone up or down.
Ratio: (Land Value + (Basic Cost * Avg Index)) / Sales Price. (Ex: $78,000 + ($290,655 * 1.065) / $378,418 = 1.024) Avg Index means, the mean of all parcels indicated index.
This ratio shows, what if the New Indicated Index (Avg Index) applied on individual parcels. i.e.
((Replacement Cost New + Land Value)/ Sales Price).
Analyze: By clicking on this button, it will perform the computational analysis and gives the output in the above respective fields.
Exclude: User can exclude the parcels from the selected sales information list and can perform analyze without excluded parcels. User may do this when some buildings involve fancy construction (costlier), doesn’t want to affect that increase in RCN through index for all the buildings in the county. For those type of fancy constructed parcels, user should adjust the index manually. (or) user may exclude in case of parcel didn’t picked up the new improvement at the time of index study.
Reset: This will put all the parcels under the selected sales information which have new improvement in the Capture for that base year.
Pending: Excluded and land only parcels will be shown under the pending list.
Mean Indicated Index: Average of all parcels individual Indicated Index.
New Indicated Index: Average of all parcels individual Indicated Index. This is the index which should be applied on all the buildings once user got approval. That index can be altered as per the user requirements.
Computed Ratio: Average of all parcels Ratio.
Average Absolute Deviation (AAD): Average {Absolute [Indicated Index – New Indicated Index]}. If this deviation index is more, so user should realise that few significant sales are affecting the new indicated index. So, user should re-analyse by removing the affecting parcels.
Print All / Selected parcels: User can print All / Selected parcels which are calculated as per the Individual Indicated index, Avg. indicated index or existing Index for the approval of state.
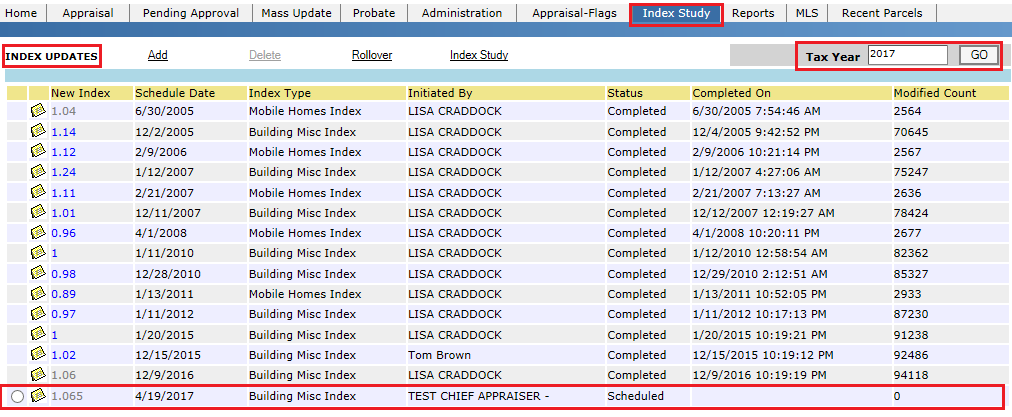
After finalizing the index, county is required to send that index for state approval and can schedule that index update to affect all the parcels in the county by clicking on Add hyperlink in Index Updates page.
Verification: Applied index will be shown under building value table of the parcel.
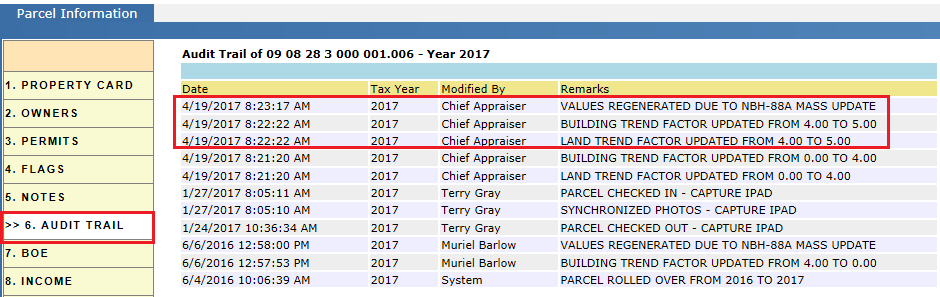
Audit Trail: Verify the audited information of Index Update.
Sales Analysis
Sales Analysis is performed to make sure that market values of all the parcels in the neighborhood is reflected as per the market price. User will perform sales analysis to find ratio and can apply to all parcels at the neighborhood level. Capture will perform sales analysis automatically, daily in the night at neighborhood level throughout the county. In Base year, while doing sales analysis, all the market adjustments and Nbh level trend factors (Land & Buildings) will be removed. Then sales analysis should be performed at the county level using Consolidated Neighborhood Analysis report. If the Mean ratios are not in the acceptable limits for some neighborhoods, then that respective user must study the data using the tools provided by the Capture and do necessary adjustments (like Land/ Building Mass Updates) to put the ratio in acceptable limits. Then user must Re-run the analysis and will do market adjustments in the neighborhood model (If Necessary). The idea behind adjusting the Mean ratio is to take that mean nearer to 1 (i.e. Acceptable Limit). Typically, county don’t adjust the trend factors in the base year. In Subsequent years, first sales analysis must be performed at the county level using Consolidated Neighborhood Analysis report. If the Mean ratios are in the acceptable limits for all neighborhoods then no need to perform index study, only land & building trend factors must be adjusted. Typically, at this stage Land Schedule is not going to be adjusted. If the Mean ratios are not in the acceptable limits, market adjustments must be removed and index study must be performed. Every year, when sales analysis is completed, the values will be locked and board notices will be sent to tax payers.
Work Flow
In the Base year, user must perform sales analysis at the county level using Consolidated Neighborhood Analysis report.
Navigation: Ratio Study -> Neighborhood Report
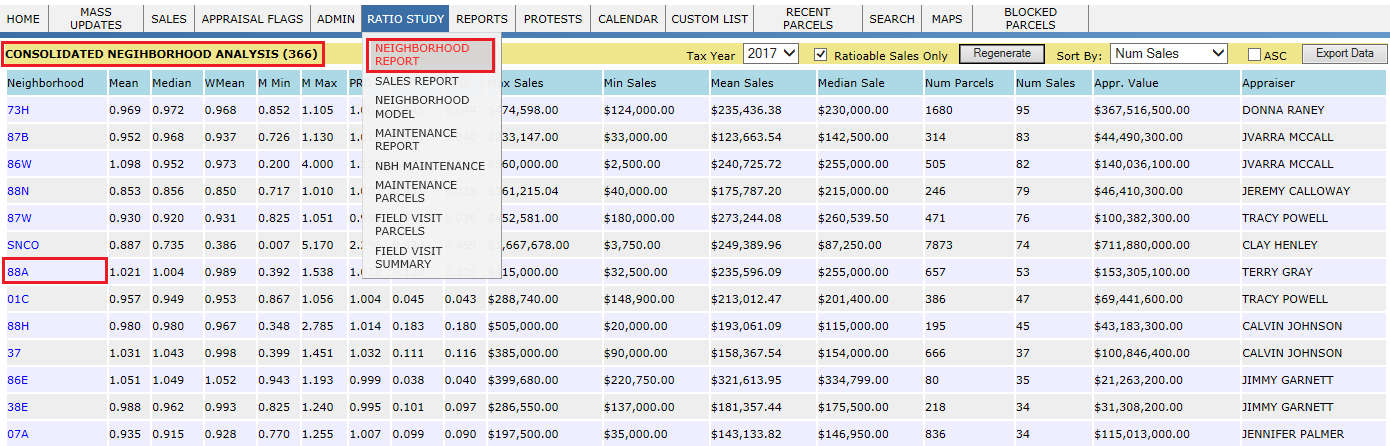
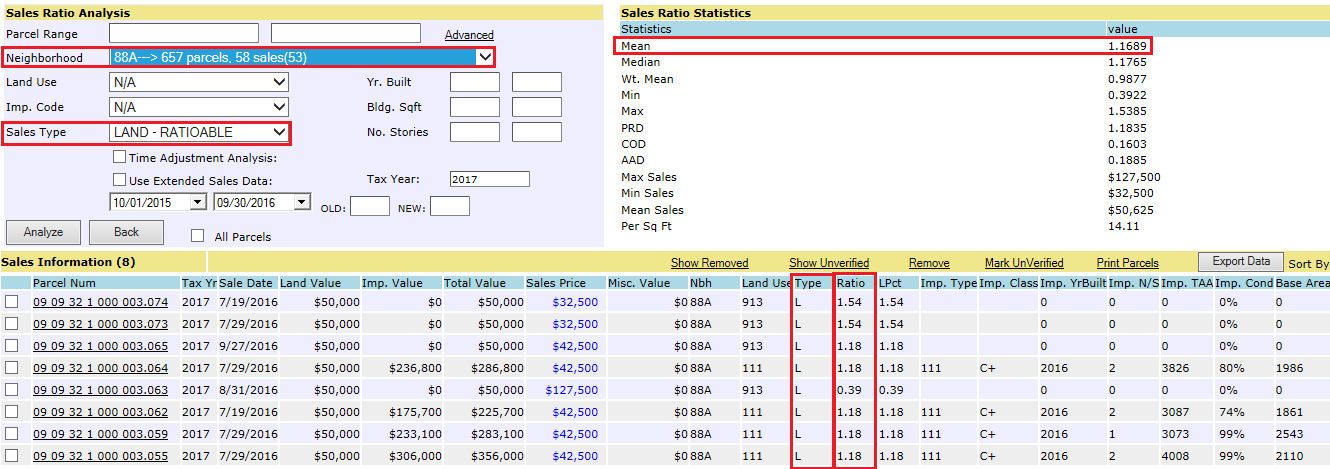
If the Mean ratios are not in the acceptable limits for some neighborhoods, then the respective user must first perform the land – ratioable analysis & find the factors to adjust the land schedule in the neighborhood model.
If the sale type is Land - Ratioable, it calculates the ratio by comparing land value to the sales price.
Next, user must first perform the Building – ratioable analysis and find the factors to do building adjustments in the neighborhood model.
If the sale type is Building - Ratioable, it calculates the ratio by comparing Total value to the sales price.
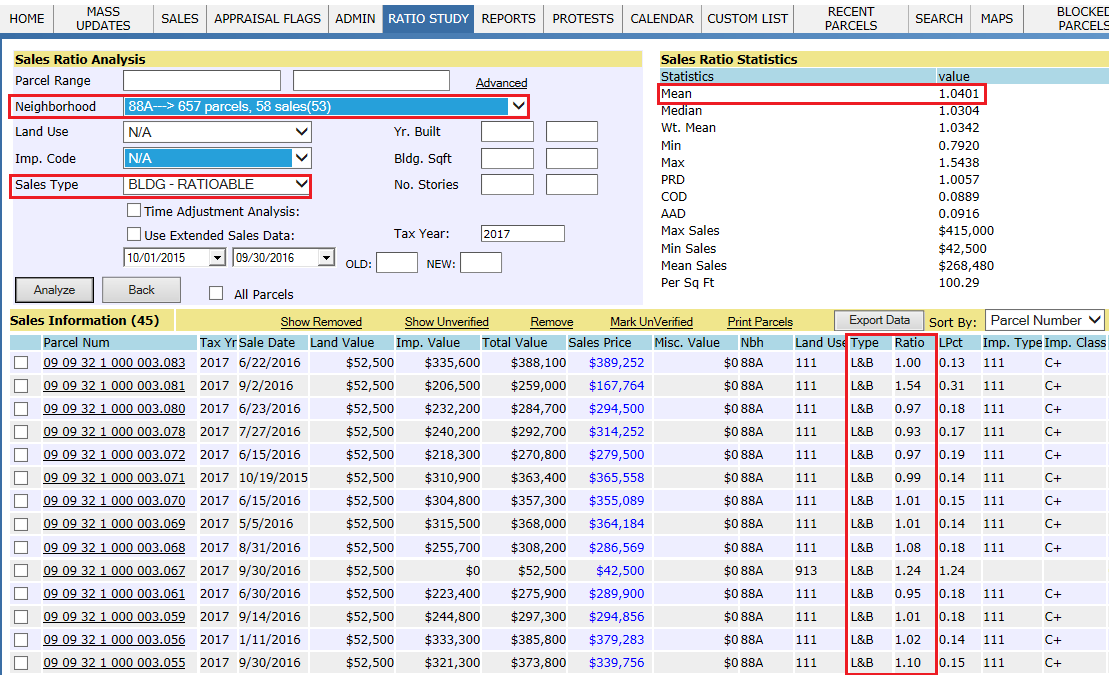
Sales Ratio Statistics:
Mean:
Sum of sales Ratio’s/No. of Sales
By seeing this ratio user can predict, market in that neighborhood has gone up or down.
Median:
Arrange the Sale ratio’s in ascending or descending order.
For Odd Count: Pick the middle ratio as Median. For Even Count: Average of two middle ratios’ is equal to Median. By seeing this ratio user can predict, if the median ratio is less than 1, most no. of sales in that neighborhood dominates the appraised value. If it is greater than 1, in most of sales, appraised value dominates the sales value.
Wt. Mean: (Weighted Mean)
Sum of Appraised (Total) Value/Sum of Sales Prices.
Min:
The ratio where the sales price is very high compared to the appraised value. By seeing this user can predict that, market for that property is gone very high in the neighborhood compared to the appraised value.
Max:
The ratio where the sales price is very low compared to the appraised value. By seeing this user can predict that, market for that property is gone very low in the neighborhood compared to the appraised value.
Average Absolute Deviation (AAD):
AAD = Σ (Sales Ratio’s – Median)/No. of Sales
If AAD is as less as further tending to smaller value, user can predict that there is no large variation between sales and appraised values in that neighborhood.
Coefficient of Dispersion (COD):
(AAD/Median)
The average deviation of a group of sales ratios from the median. By seeing this, user can predict that, how the sales ratios are clustered around the median.
Price Related Differential (PRD):
PRD = Mean/Wt. Mean
PRD = (Sum of sales Ratio’s /No. of Sales)/ (Sum of Appraisal (Total) Value/Sum of Sales Prices).
PRD is used to measure the value related inequities in the appraisal system, referred to as regressivity or progressivity. Appraised values are regressive if high values properties are under appraised relative to low value properties and progressive if high value properties are lower appraised relative to low value properties. PRD above 1.03 tend to indicate assessment regressivity; PRD below 0.98 tend to indicate assessment progressivity.
Min Sales:
By seeing this, user came to know that minimum sale happened in the neighborhood.
Max Sales:
By seeing this, user came to know that Maximum sale happened in the neighborhood.
Mean Sales:
Avg sales price happened in the neighborhood.
Per Sq Ft:
Sales Price / Living Area.
Land & Building Adjustments
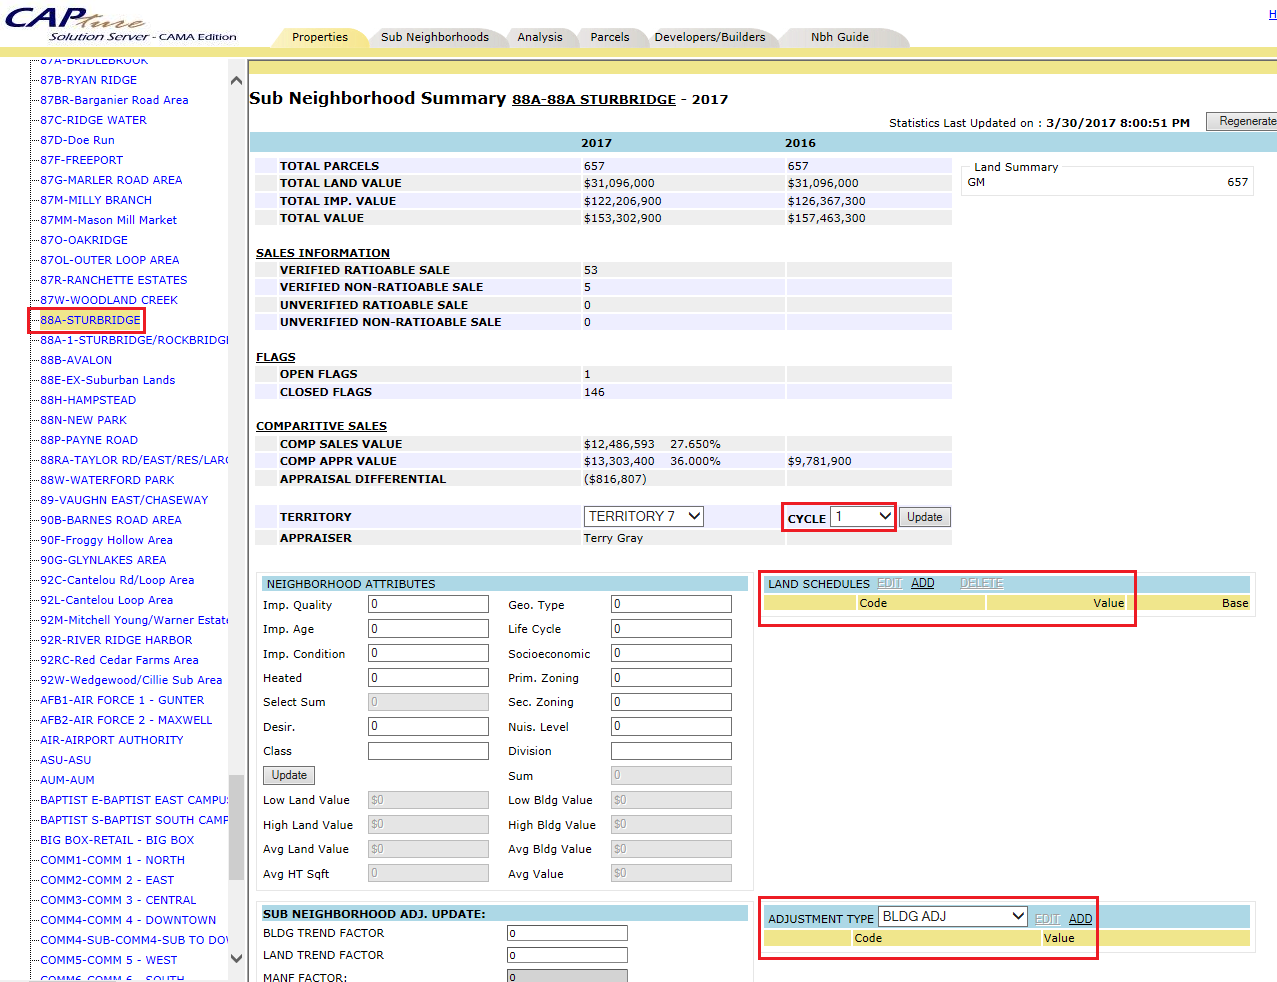
Land & Building adjustments can be performed under the Land Schedules & Adjustment Type sections of Neighborhood Model dashboard by selecting the specific neighborhood.
Navigation: Ratio Study -> Neighborhood Model -> Dashboard.
In Subsequent years, first sales analysis must be performed at the county level using Consolidated Neighborhood Analysis report.
If the Mean ratios are in the acceptable limits for all neighborhoods then no need to perform index study, only land & building trend factors must be adjusted in the neighborhood model.
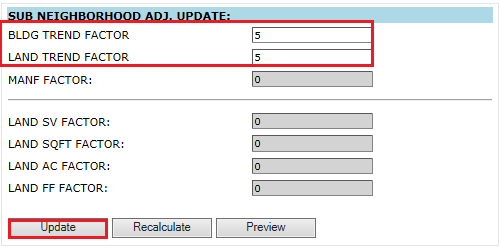
Typically, at this stage Land Schedule is not going to be adjusted.
If the Mean ratios are not in the acceptable limits, market adjustments must be removed and Index study must be performed as shown Index study section.
Verification:
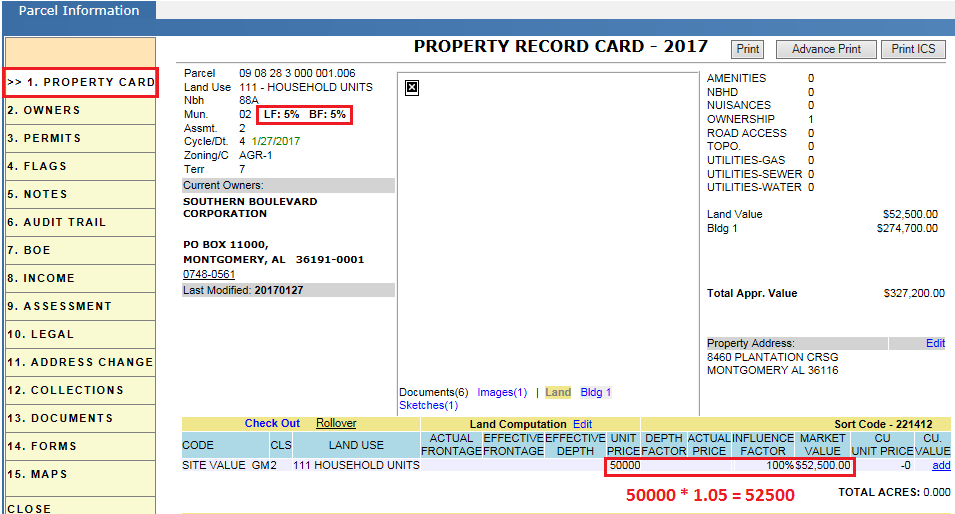
Updated trend factors will be shown as LF & BF in the parcel info hyper region. As per LF, it will calculate the market value of the land.
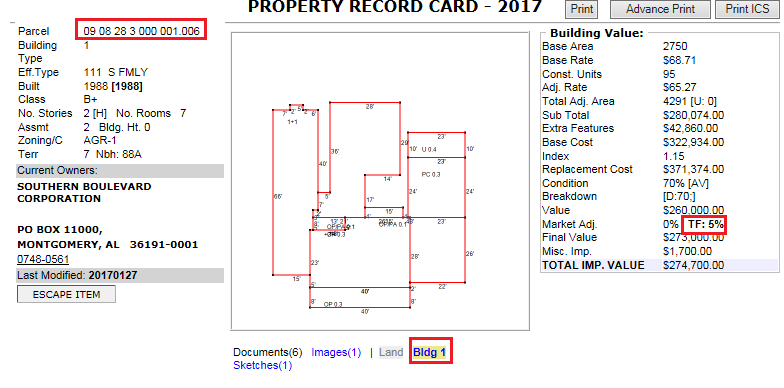
Building Factor is calculated in the form of TF in the Building value hyper region.
Audit Trail: Updating of Land & Building trend factors and values regenerated through mass updates got audited.
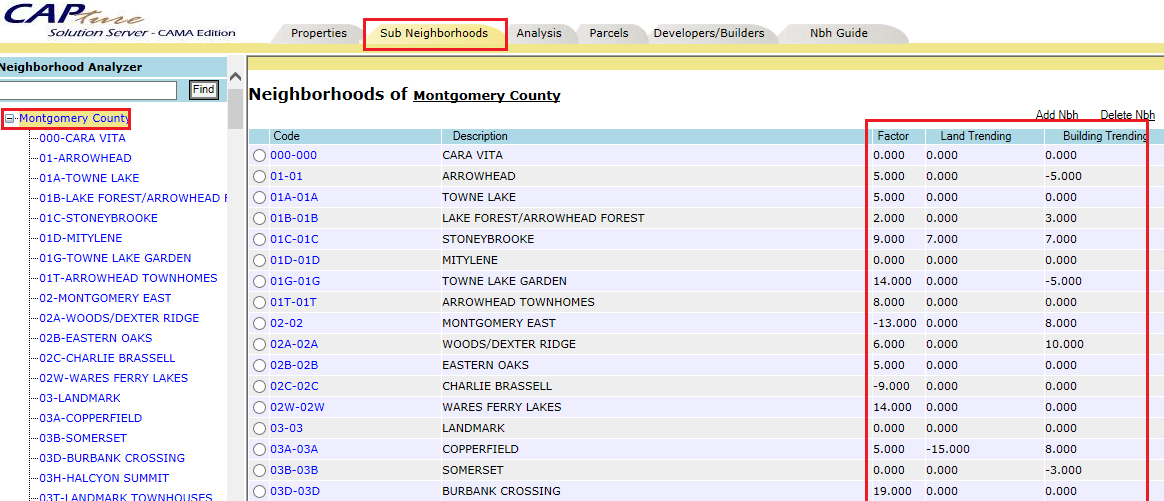
Reports: All the Market Adj. factors, Land Trend & Building Trend Factors of different neighborhoods will be seen under Sub Neighborhood dashboard of the neighborhood model.
Navigation: Ratio Study -> Neighborhood Model -> Dashboard -> Sub Neighborhood.
Every year, when sales analysis is completed, the values will be locked and board notices will be sent to tax payers.

Confidential | Copyright © 2017 E-Ring, Inc.